Daily EURO Support Resistance levels ~ most accurate forex trading signals
Support and Resistance
EUR USD Technical Chart Analysis
The EURO started to move upward today, after yesterdays news shakeout at 7 p.m. GMT, which cleared the stops above the low of Sept. 10th at 1.2755 and then reversed to clear the stops below 1.2724.
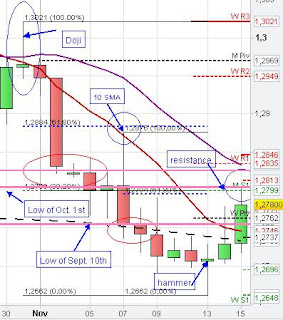
Todays upward momentum might be the following of the daily hammer candlestick pattern on Tuesday.
The Euro moved higher with the triggering of continuation patterns (green circles/ellipses) and Breakout timing setups (red circles/ellipses) until market reached strong resistance at the 1.28 level. This resistance zone consists of the low of October 1st, the monthly S1, the 61.80 % Fibonacci retracement on the 4 hour chart and the 38,20 % Fibonacci retracement on the daily chart. Market reversed at the 1.28 level and started to move lower.
On the 5 min chart we see how market broke through the downward sloping green trend line at 2:15 p.m. (Breakout trading-prior candle closed at trend line) so that the consolidation/ triangle got terminated. Market started to consolidate in a shape of a continuation pattern after the breakout of the triangle and price retested the daily R1, the high and the downward sloping trend line of the consolidation (resistance becomes support-successful retest). The Euro terminated the continuation pattern on the 5 min chart and market broke through yesterdays high with the beginning of the new hourly candle after the previous one closed strongly at resistance (yesterdays high-Breakout trading).
Recent main support and resistance levels have been the low of October 1st and September 10th and the high of last Tuesday. Yesterdays high (news spike) is also likely to play an important S/R role.
 |
| Daily Support and Resistance EURO Fibonacci retracement |
 |
| 4 hour Daily EURO Fibonacci retracement, Resistance Levels |
 |
| hourly EURO Support/ Resistance |
 |
| 5 min Support and Resistance |
The Chart Analysis of the trading days before
On the daily chart (first chart) we see that the EUR/USD created a hammer candlestick pattern yesterday. Market moved higher and the Euro is currently trading at the low of September 10th at 1.2755 (pink line) and the daily 10 SMA. Slightly above is the hourly 200 SMA, the weekly Pivot point and the daily R2.
Yesterdays high at 1.2729 (thick blue line below) initially acted as resistance but after the level got broken the blue line acted as support and market bounced back from yesterdays high (successful retest, changing role of daily S/R levels). The rising 20 SMA on the hourly chart also provided support at 7 a.m. together with the consolidation price zone (green ellipse, orange arrow) and again at 4 p.m..
 |
| 1 hour Hammer Chart Pattern | Daily S/R | SMA |
More info for Daily EURO Support Resistance levels ~ most accurate forex trading signals:


0 komentar:
Posting Komentar